
If your goal is financial independence and reaching a level of personal wealth that would allow you to work less or retire early, how can you know if you are on track to do this? There are arguably several important stats you should be tracking regularly, or at least be aware of, to help you decide if you need to change things or if you’re behind or ahead of schedule. The most important metric to track is your net worth, which I’ll be focusing on in this post.
Net worth
This is the big one, increasing net worth is the main goal. It’s “net” because it’s everything you own (bank account balances, investments, property), minus everything you owe (loans and credit card debt). Some people include property assets at their current market value (if that can be estimated), but I think a fairer way is to include them at their purchase cost. Cars should also be counted at their depreciated value to be fair.
Your net worth goal is personal to you and will depend on what kind of lifestyle you want and what matters to you when it comes to spending. One thing to be aware of is that it should not be an arbitrary number like £1m as this may not be in line with what you actually need.
If your net worth goal is too high you would be saving too much and could afford to live less frugally in the mean time by spending more and enjoying your wealth now. If your goal is too low, you might be in for a surprise when you eventually need the money. It’s a good idea to track your net worth and see how this compares to your goals so you can adjust things along the way.
A program like Money Manager EX that I described in my previous post is a great way of doing this. It will track the value of all of our assets and liabilities over time. With all this data, we can create a stacked bar chart with a line for the overall net worth and bars that show the changes in the different components over time. We can then address these individual elements if they are detracting from our progress on net worth growth (for example high-interest credit card debt or loans).
The example below would be one nice visual way to track your total net worth over time (solid pink line), and see which components are the main drivers of this change over time, e.g. the investment value (orange bars), or the student loan balance (light blue bars). This fictitious example illustrates a negative net worth (more debt that assets) becoming a positive net worth in 5 years, after paying off more of the student loan and increased investing.
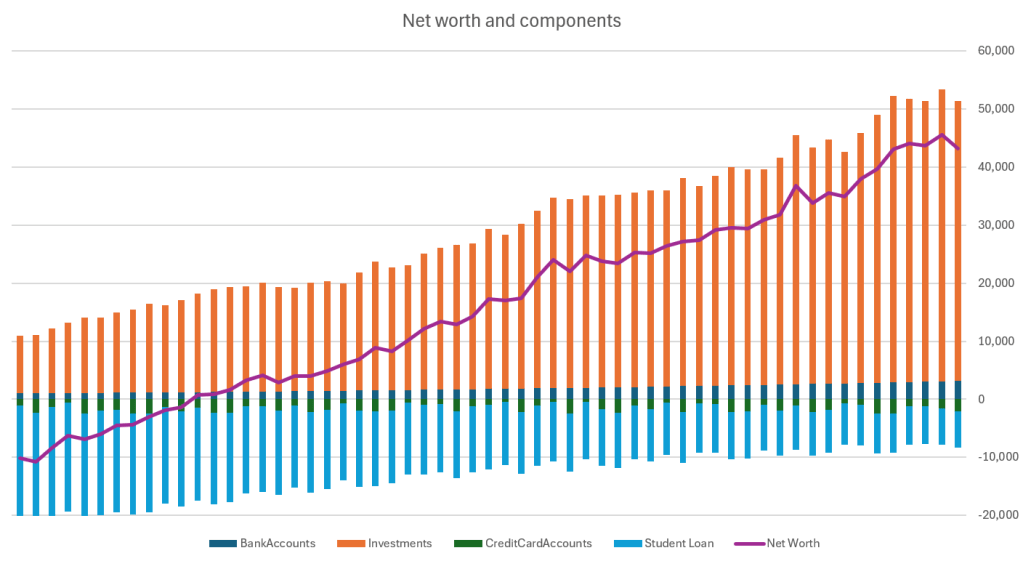
The less important elements in this example are the credit card balances (green bars) and bank savings accounts (dark blue bars), which have relatively small balances and don’t vary much month to month. This sort of information can really help identify the most important areas to focus on to assist with financial planning and setting goals so I’d recommend trying something similar.
It’s important to note that wealth creation, where investment is involved, relies on the compounding effect, so your march towards a net worth goal will not happen linearly over time, the progression is actually an upward sloped curve, slower at first but accelerating strongly the closer you get to your goal, so factor this in when considering if you are on track. There are a number of videos which illustrate this effect very well, and it may surprise you to know that it takes roughly the same amount of time to get from £0 to £100k as it does to get from £500k to £1m.
How does your net worth compare?
Once you’ve calculated your net worth, naturally you’ll be interested in how it compares to others. Whilst I’d recommend not comparing yourself to others, it can be instructive to see what people who have been successful at building wealth do with it.
First, the ONS has some depressing statistics about the wealth distribution. At a very high-level, just 4 years ago in 2020 the median wealth was £302,500. However, as this number is for most of the population as a whole it’s not a great number to compare against depending on your age, and the younger you are the less well you’ll compare against it.
| Percentile | Household Wealth |
| Bottom 10% | £15,400 |
| Lower Quartile (25) | £71,000 |
| Median (50%) | £302,500 |
| Upper Quartile (75%) | £733,800 |
| Top 10% | £1,413,700 |
| Top 1% | £3,668,200 |
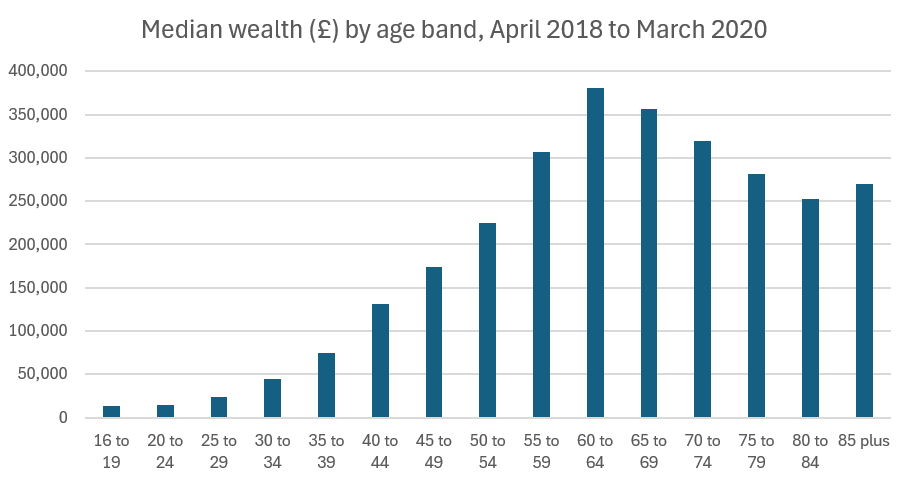
When we look at just the median wealth by age (chart below), it becomes clear that there is also a generational wealth gap, so these numbers are a more relevant (though still not perfect) comparison. It’s also sad to note that these numbers are poor by most measures, and I’d like more people, particularly the younger generations to start to make regular investing a key part of their financial planning, as the time component is extremely valuable and gives them an advantage over the older generations when it comes to building wealth.
Clearly there is considerable wealth inequality in the UK, with the top 1% having £3.6m and the bottom 10% having less than £15k. Looking at the asset mix, it’s interesting to note that the wealthiest have a lower proportion of their wealth tied up in property assets, and a much larger proportion in “net financial” assets (savings and investments, minus any debt).
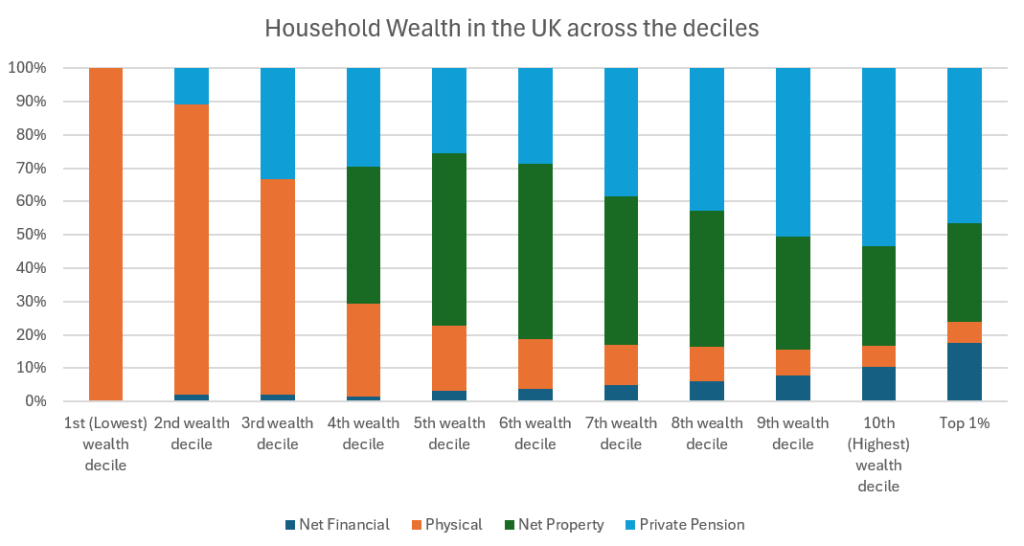
Pension balances are unsurprisingly larger for the wealthier (and usually older) deciles. This highlights the importance of making workplace or personal pension contributions, taking advantage of employer pension contribution matching, investing in ISAs and other tax-efficient investment accounts, and starting this as early as possible to allow the compounding effect time to work.
Conclusions
Information is powerful, and there’s no better way to gain control over your finances than knowing exactly where you stand. It may be that you are hesitant to find out what your net worth is and what direction it’s heading in, but the sooner you know what the number is and what is driving it, the sooner you can take action to improve it. This doesn’t have to be a monthly exercise by any means, I do this because I’m interested in tracking these things and enjoy the stats, but do it at whatever interval makes sense for you.
Once you know your net worth number, one of the ways of taking action to increase it is by managing the saving and investment rate and making sure you have control over the monthly income and expenses, which I’ll be covering in next week’s post. Let me know in the comments if you track your net worth regularly or whether this approach is something you’re going to try. Thanks for reading.
References and further reading
- Previous post on software for managing personal finances
- A good example from The Money Guy YouTube channel of the compounding effect and the time to reach £1m
- ONS Wealth and Assets Survey 2020
- ONS Individual Wealth in Great Britain dataset

Leave a reply to Which financial metrics should you track? Part 2: Income and Expenses – Exploratory Finance Cancel reply